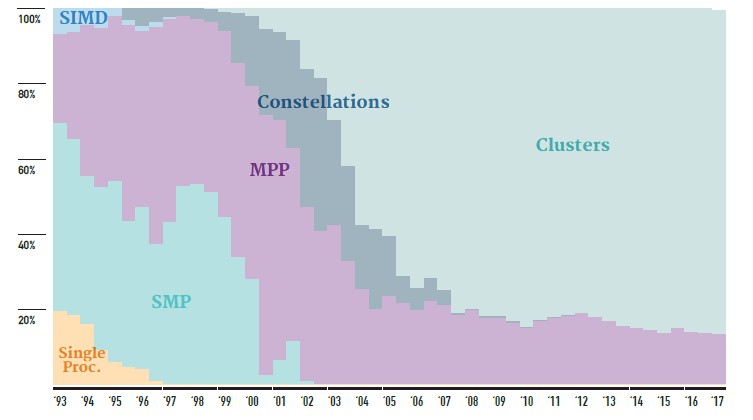
There is a lot of change coming down the pike in the high performance computing arena, but it has not happened as yet and that is reflected in the current Top 500 rankings of supercomputers in the world. But the June 2017 list gives us a glimpse into the future, which we think will be as diverse and contentious from an architectural standpoint as in the past.
No one architecture is winning and taking all, and many different architectures are getting a piece of the budget action. This means HPC is a healthy and vibrant ecosystem and not, like enterprise datacenters and, until very recently, hyperscalers, a monoculture that is not providing the most efficient compute for the job and in a post-Moore’s Law world possibly subject to extinction.
In HPC, Cambrian explosions have long since been normal and accepted. It is how the future is constantly being created and the past not destroyed, but evolved. And all aspects of compute, network, and storage eventually benefit from this constant innovation. That is the real value of HPC. Our phones are the kind hybrid supercomputing conceived of in the 1980s and built into systems in the 1990s and 2000s and shrunk into our hands in the 2010s.
The HPC community is bracing for some big changes in compute, that is one thing for sure. Intel, AMD, and IBM are getting ready to launch their respective “Skylake” Xeon-SP, “Naples” Epyc, and Power9 processors, and Nvidia has announced its “Volta” Tesla V100 GPU accelerators and AMD is getting ready to take the wraps off its “Vega” Radeon Instinct alternatives.
Cavium is also readying its ThunderX2 processors based on its own designs and we hear it is also prepping variants based on the “Vulcan” ARM processors created by rival Broadcom, which sold off that business to Cavium quietly late last year. Qualcomm, which very much wants to break into the datacenter to boost its profits, is ramping up production for its Centriq 2400 ARM chips, too, and will get traction among the hyperscalers and more than a few HPC centers, too. So far, only the Skylake Xeons, which Intel started shipping about nine months ago to its hyperscaler customers and ramped into some HPC accounts earlier this year, are the only new compute engines that have reached the Top 500 list, but more will appear in the November 2017 list and by this time next year, the picture could be a lot different, particularly among the bottom 450 machines on the list. The organizations that build these machines may set the pace for the future of HPC as much as the capability-class machines and their exotic architectures. The churn could be much more intense down there.
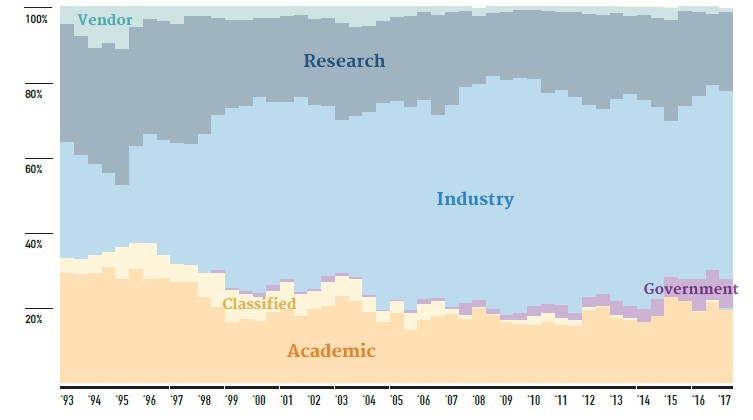
While the Top 500 rankings have helped give us a sense of what is going on in the HPC space since the summer of 1993, it is important to not its limitations. Not every supercomputer, much less every cluster at an HPC center, is on the list. Participation is voluntary, not compulsory. So some big important machines, like the “Blue Waters” system at the National Center for Supercomputing Applications, are missing from the rankings. Moreover, for strong political reasons, many companies that are not traditional HPC shops – including telecommunications, hosting, and cloud computing firms – are now running the Linpack parallel Fortran test to get on the rankings.
In the June 2017 list, for instance, Facebook is showing off the performance of a deep learning cluster it built using DGX-1 systems built by Nvidia, not its own clusters comprised of its own Open Compute “Big Sur” and “Big Basin” GPU-accelerated systems. While the Top 500 is interesting in that it ranks machines based on their theoretical and measured double-precision performance on matrix math calculations, and the relatively new High Performance Conjugate Gradients (HPCG) test does a better job stressing systems in a manner that actual applications do, what we quite possibly need is a cornucopia of tests, including machine learning workloads, that would be used to rank machines. Double precision may not be as important in the future as it has been in the past.
That said, ranking machines by Linpack performance is still fun, and it still means something inasmuch as it gives us some relative performance metrics and it actually helps drive architectures and changes across them. If you don’t think Linpack did not help establish the GPU as a viable accelerator, then you are wrong, and that establishment by the HPC community meant that ever-more-powerful GPUs were created by Nvidia and in fact drove the development roadmap so the hyperscaler community that did all the breakthrough research on machine learning could benefit from that foundation. Now, HPC is benefitting from the pressure that hyperscalers put on Nvidia to push the performance envelope, and moreover, machine learning is being applied to augment traditional simulation and modeling workloads so more work can be done with less flops
These virtuous cycles are radically changing the nature of computing, both in terms of the hardware and the way programs make use of it.
In the end, legacy Fortran and C applications could just end up being a kind of API that machine learning algorithms can invoke to simulate a workload and then predict and project out from using machine learning techniques, keeping it all as close to reality as possible, we presume, by injecting the machine learning models with real-world data. The architectures that companies will choose will have to be able to both sorts of computing, HPC and machine learning, and it will be best if a single machine can do both to minimize the very costly (in terms of time and money) movement of data.
For now, though, there are very few machines on the Top 500 list that do both traditional HPC and AI at their day jobs, even though some of the architectures currently deployed would certainly allow for that.
Breaking Down The List
Bragging rights matter in HPC, and not just because the governments of the world use supercomputers to design and maintain nuclear weapons. They are a symbol of technological and economic might, which is why China has been so aggressive in running Linpack on the clusters installed at telcos and cloud service providers to boost the presence of China on the list. If the hyperscalers in the United States – Google, Amazon, Microsoft, Facebook, IBM, Rackspace Hosting, and a few others – got all political and ran Linpack on the millions of nodes they have in their clusters, they could push out the middle couple hundred machines in the list, and we are fortunate that they do not do this and thereby skew the validity of the rankings in reflecting in some measure what is happening with HPC systems that are used for simulation and modeling and, now sometimes, data analytics and machine learning.
Right now, China still has bragging rights, with the two most powerful machines on earth, and Europe is on the rise with a beefier and tuned-up hybrid CPU-GPU system.
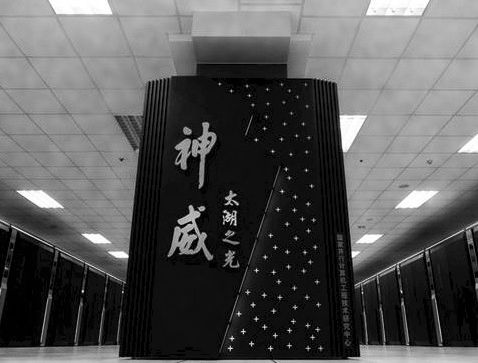
The Sunway TaihuLight massively parallel CPU system installed at the National Supercomputing Center in Wuxi, China, retains its top ranking on the list, with its 10.65 million cores based on the homegrown SW26010 processor delivering 125.4 petaflops of peak theoretical performance and 93 petaflops on the Linpack benchmark. The Tianhe-2 system installed at the National Super Computer Center in Guangzhou, China is still ranked second, with its mixture of Xeon CPUs and Xeon Phi accelerator cards delivering 3.12 million cores that have a peak speed of 54.9 petaflops and deliver 33.86 petaflops of sustained performance on the Linpack test.
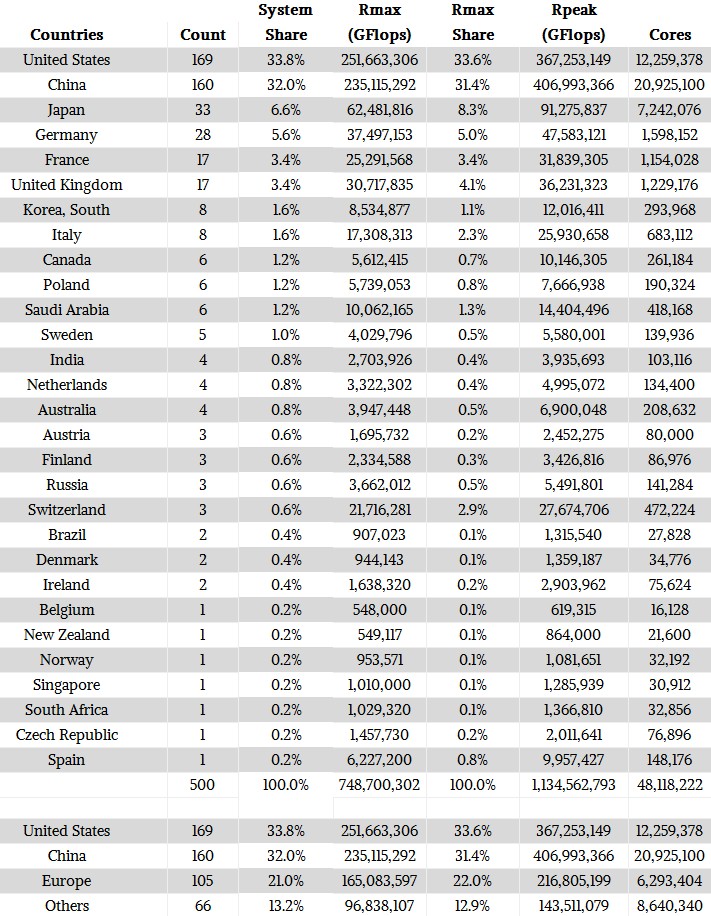
The next biggest machine in China on the list is the now vintage Tianhe-1A hybrid CPU-GPU system that was installed back in 2010 using a mix of “Westmere” Xeons and Nvidia Tesla 2050 GPU accelerators and that put China on the map as a bigtime player in supercomputing; that machine is now ranked 48th on the list with its 2.56 petaflops of sustained Linpack oomph. All told, China has 160 of the 500 machines on the list, with an aggregate performance of 235.1 petaflops; there are a lot of machines from a lot of different vendors with many different architectures, but the three machines above dominate the installed base of performance in the Middle Kingdom.
Here is the breakdown of the current Top 500 by country, in terms of system count and aggregate performance:
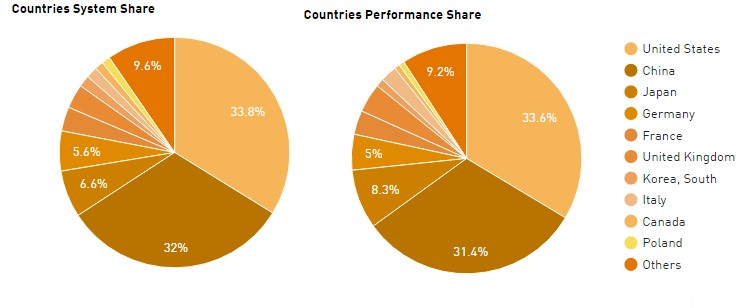 For those of you who like to see the raw data, we have compiled this and added a share of the performance as well as summarizing the aggregate computing of the United States, China, and Europe from the rest of the world. This is the fractal scale at which the world thinks these days, and yes, we are all from countries or states that are at a finer grain than this. We could sort by who is on the UN Security Council, we suppose. Anyway, the table:
The interesting bit as far as we are concerned is that the share of systems and share of Linpack sustained performance pretty much track. (This is not the case when you look at the Top 500 list by vendor, as you will see in a moment.) All three of the key markets – the United States, China, and Europe – have a significant share of the compute capacity, as you would expect given the relative size of their economies. China has the resources and ambition to keep investing in HPC and has overtaken Europe and, given the current level of spending, will very likely overtake the United States. Unless there is a radical change in budgeting for supercomputing, or the cloud providers start peddling lots of flops on an hourly basis and we start counting this, too. At some point, to get an honest reckoning of the HPC capacity in countries and sold by vendors, we need to start counting the flops consumed per year on private systems and clouds and not take a static snapshot of the performance of 500 machines with the highest performance.
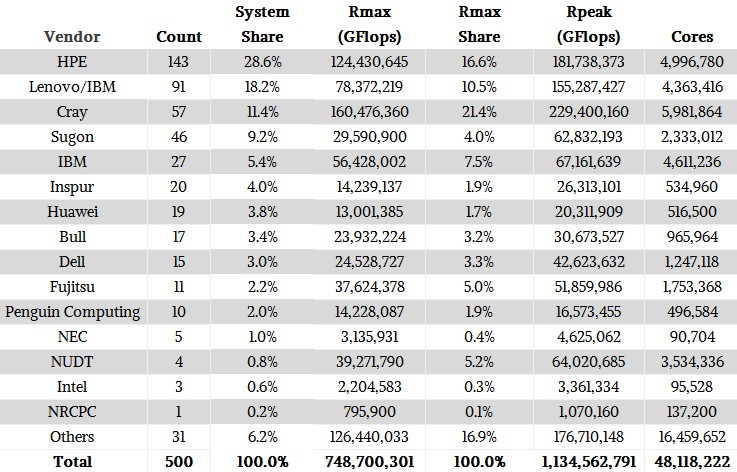
For now, we still think about who is selling what system to do HPC work, and Hewlett Packard Enterprise, which used to be neck-and-neck with IBM when Big Blue sold X86 clusters, is now the dominant supplier of HPC systems on the Top 500 list.
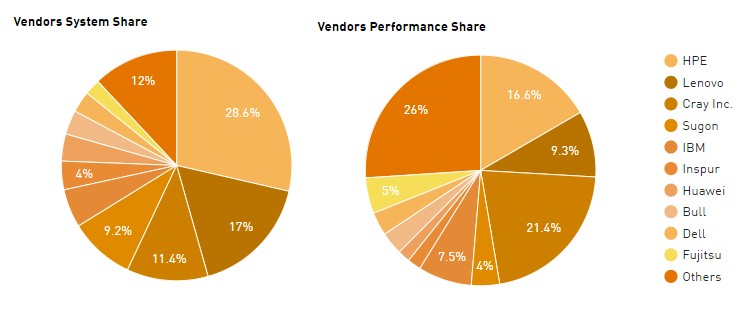 If you want to drill down into the details of the breakdown by vendor, this will help:
For simplification, we have added any joint IBM/Lenovo systems to the Lenovo statistics. The IBM systems are predominantly for Power-based clusters (BlueGene or otherwise) that never had anything to do with its X86 server business. HPE’s data in the Top 500 now includes machines installed by SGI, which has a fair number of big iron NUMA boxes in its UV line as well as more traditional clusters in its ICE line helping pump it up. (HPE bought SGI last year, you will recall.) HPE and Lenovo have a much smaller share of the installed capacity than their share of installed systems, while Cray and IBM go the other direction and have a much higher share of the compute capacity than share of the systems. This is the difference between focusing on capability-class machines that are designed to scale a few key workloads for customers and designing capacity-class machines that are designed to run a slew of workloads all at the same time, or more precisely, all through the same job scheduler that manages access to the compute.
The rise of the Chinese vendors is reflected in the rankings of Sugon, Inspur, and Huawei Technology, and the acquisition of a sizeable chunk of business in Asia by Lenovo when it bought the System x business from IBM in 2015. Lenovo also has a fairly large business in Europe, thanks to that IBM connection, and the other Chinese system makers are pushing into Europe, the Middle East, and Africa – much less hostile sales environments for them than the United States and Canada, for sure.
The big mover in the Top 10 of the Top 500 is the “Piz Daint” Cray XC50 system installed at the Swiss National Supercomputing Centre (CSCS), which was upgraded with a bunch more Nvidia Tesla P100 accelerators that are based on the “Pascal” generation of GPUs. The techies at CSCS worked to tune their code to make better use of the GPUs and the “Aries” XC interconnect and were able to get 100 percent more performance out of 75 percent more cores. With the prior Piz Daint machine, 39 percent of the peak flops went up the chimney, but with the expanded machine, only 22.6 percent does. This is about as good as it gets when it comes to efficiency, at least on the Linpack test. The net result is that Piz Daint surpassed the “Titan” system at Oak Ridge National Laboratory, which was built in 2012, with its 19.59 petaflops of sustained performance. Titan, a Cray XK7 hybrid Opteron-Tesla GPU system using the “Gemini” interconnect, has been on the list since November of that year and has not changed since then. The big change at Oak Ridge comes in late 2017 and into 2018, when the first IBM Power9-Nvidia Tesla V100 hybrid machines get to work and that US Department of Energy Facility has a machine with over 200 petaflops and, very likely, becomes the most powerful system in the world. The number five system on the current list, the “Sequoia” BlueGene/Q system made by IBM for Lawrence Livermore National Laboratory, will be upgraded with a similar machine, called “Sierra” and very likely in the same performance band.
Rounding out the Top 10 is the number seven Oakforest-PACS system using “Knights Landing” Xeon Phi processors and 100 Gb/sec Omni-Path interconnect from Intel, which delivers 13.55 petaflops sustained, and the number eight K system from Fujitsu based on the Sparc64-VIIIfx processor and the Tofu interconnect, which weighs in at 10.51 petaflops and is still the most efficient (from a processing standpoint) machine on the Top 500 list with a stunning 93.2 of theoretical flops being used to deliver that performance. The Oakforest-PCS and K machines were commissioned by the Japanese government, and the K machine is being followed on by an exascale ARM cluster. The Mira BlueGene/Q system at Argonne National Laboratory comes in at number nine on the list with 8.59 petaflops sustained, and it was supposed to be followed by the 180 petaflops “Aurora” system comprised of future “Knights Hill” Xeon Phi processors from Intel plus a revved up Aries interconnect. But we have been hearing that this machine will come out with a different architecture and at a later date, possibly going straight to exascale performance so Argonne can be the first to break that barrier. (It is ambitious to try to beat the three Chinese projects and the one Japanese project with the same aim. We respect ambition, but the industry needs execution, too.) Finally, number ten is the “Trinity” Cray XC40 Xeon-only cluster based on the Aries interconnect that is installed at the Sandia National Laboratories under the auspices of the US DoE.
Now, for some trend analysis across the list.
First, even with GPU and other kinds of acceleration added to the architectures and substantially improving the performance of the HPC systems, the progress of supercomputing as gauged by the most powerful systems in the world is still slowing. (Imagine if GPU acceleration had not come along. . . . )
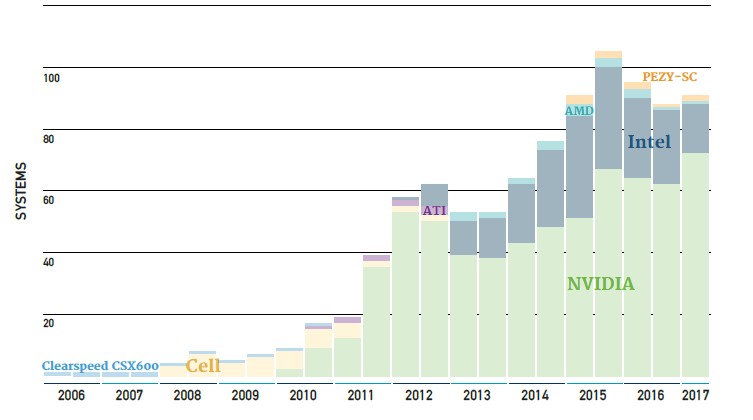
There are 91 machines on the June 2017 Top 500 list that have accelerators of some kind, which is up from 86 machines back in November. Of these, 71 are using Nvidia’s Tesla GPU accelerators and one is using AMD’s Radeon GPU accelerators; two more are using math accelerators from PEZY and another 14 are using Intel’s older Xeon Phi coprocessors. (Most “Knights Landing” customers are deploying these as host CPUs, not adjunct accelerators.)
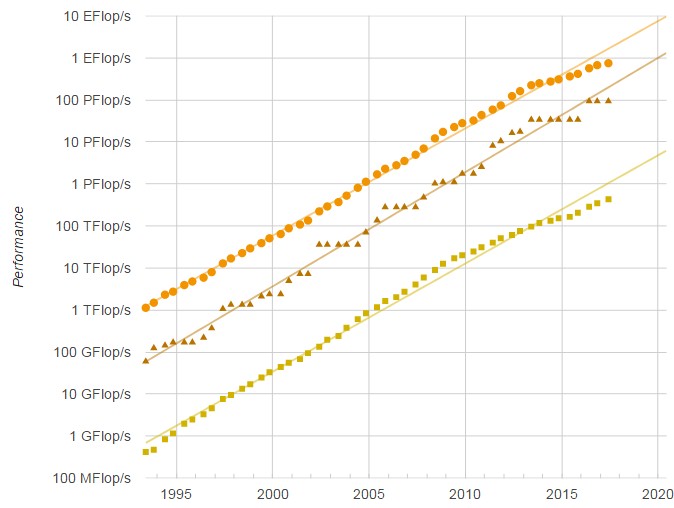
Maybe if more machines were able to deploy accelerators, the Top 500 would be on the Moore’s Law track, but what is obvious is that the aggregate sustained performance on the list should have broken through the exaflops barrier back in November. And as of the June 2017 list, the total sustained Linpack flops on the list is only 748.7 petaflops. Granted that is up by 11.4 percent from the aggregate of 672.2 petaflops in the November 2016 list and up 32.2 percent from the 566.8 petaflops of performance across the 500 systems on the June 2016 list.
Don’t get us wrong. This is nothing to shake a stick at. It is just not at the Moore’s Law pace, and it just shows that all kinds and sizes of computing are under Moore’s Law pressures.
The bottom and the top of the Top 500 list are both slowing, by the way, and it takes at least 432 teraflops to get onto the list these days. To get into the Top 100, you need a machine that breaks through 1.21 petaflops, up from 1.07 petaflops in November last year.
If this growth in flops was directly translating into more money, this would be a great market. But the cost per flops is on a downwards trend, too, and we think it is exceedingly difficult for the system makers to turn a profit in this business. In fact, we think that Intel and Nvidia comprise most of the profits in HPC compute, Mellanox Technologies and Cray comprise most of the profits in HPC networking, and if storage were added in here (which it isn’t) then DataDirect Networks and Seagate Technology would get most of the profits in HPC storage. The DRAM suppliers and flash suppliers for these systems are doing alright, too. Ultimately, more of the profits have to be spread around if this business is to be healthy.
We will be following up with other insights from the Top 500 based on briefings from the International Supercomputing Conference in Frankfurt as well as an analysis of the networking trends on the list and a look at the related Green 500 energy efficiency rankings for HPC systems.



The pie charts are almost incomprehensible due to the use of nearly identical colors. I don’t know anyone who could discern which pie slide corresponds to Germany, France, and the UK based upon the colors assigned to them. Please regenerate the figures with color schemes that follow good graphic design principles.
We are sorry for your inability to see the colors from the Top 500. You should probably discuss graphic design principles with them. Because of this we also, if you look, included all the data below them for two ways to visualize it/think about it. Your eyesight issues might have not allowed you to see that and for that we apologize.
I didn’t realize the graphics came from the Top500 website. Sorry.
The best on the Linpack test is actually 93% with K, and around 90% with Fujitsu PrimeHPC FX 10 and 100 machines, significantly more than the very respectable 78% of Piz Daint.
HPCG percent of peak shows something very interesting, with 5.3% for K and about 3% for the other SPARC machines.
By comparison, Taihu Light is just .4%. The undisputed king of HPCG efficiency is the NEC-SX ACE vector machines with >11%.
It will be very interesting to see how Summit and Sierra do in all of these tests. If China keeps on their regressive trend with Taihu Light being much worse than Tianhe 2 for HPCG % of peak and since it has a very low byte to flop ratio, they may get to #1 Linpack but it also might not be very good at doing real exascale work.
The “Trinity” Cray XC40 is installed at Los Alamos National Laboratory, just a few miles north of where you wrote that it is installed.