
Two observations. One: When the world goes into recession, the server market has immediately followed. Two: The hyperscalers and cloud builders are big enough that their server spending, or lack thereof, can in and of itself create a server recession even when there is actually not an economic recession.
With inflation sky high around the globe, central bankers have slammed on the brakes with interest rate hikes and have a firm grip on the emergency brake with other measures, like tightening the money supply, should it come to that. So far, inflation rates are slowing, and that might mean we can do a soft landing, slowing inflation without causing a jarring recession.
With this as a backdrop, the demand for compute in the datacenters and dataclosets of the world has continued more or less apace and the forecasts for this year and beyond look a little rosy. But it is also beginning to look like the rate of growth in server spending will slow in future years in concert with the tightening of the global economy. This mirrors what we have seen recently in the Ethernet switching market, which is just powering forward despite all of the uncertainty. Datacenter switching is growing a little less fast as campus switching, but both are rising this year through the third quarter at least.
The last time the public saw server shipment and revenue data out of IDC and Gartner was for the Q2 2021 market, and since then, we have been flying a little bit blind here at The Next Platform. We have been watching the server numbers like baseball stats for decades. But every now and again, we get a glimpse from either IDC and Gartner, and there is now a new market researcher on the block called Counterpoint that is also releasing some server revenue data and forecasts of its own, which we caught wind of.
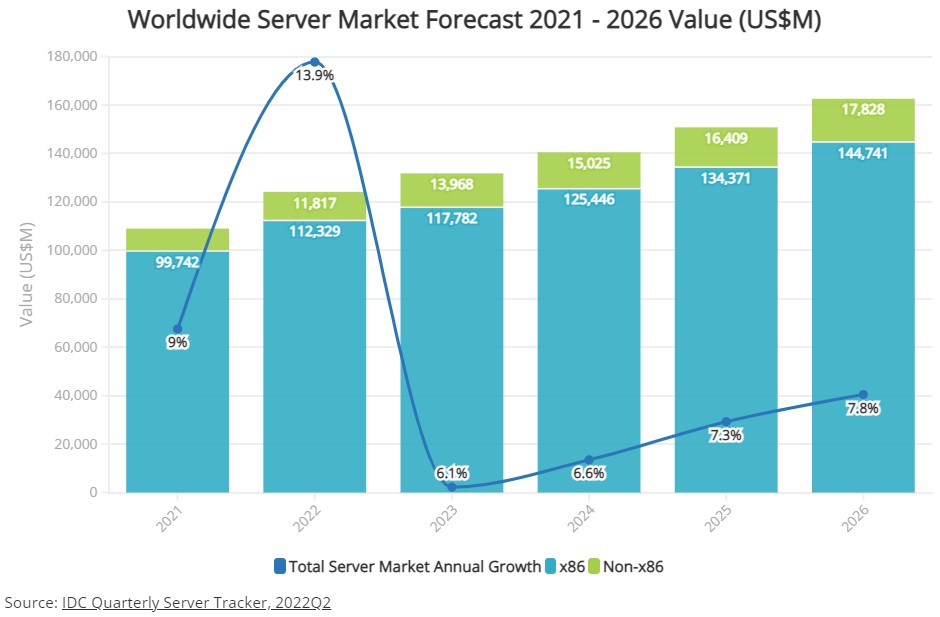
Before getting into the Counterpoint numbers, let’s take a look at the forecast for the server market that IDC put out in late September:
According to IDC’s latest server market forecast teaser, an “aging installed base is primed for refresh in 2022,” which is why the company is expecting such a sharp spike in sales this year despite supply chain disruptions and geopolitical conflict. It is unclear how much of the growth is just price inflation, but given how high inflation has been this year, it is reasonable to expect that a lot of this growth is just that: Price inflation. Shortages are also propping up prices and limiting competition, especially with certain server components such as power supplies and network interface cards.
IDC expects for the hyperscalers and cloud builders to do refreshes and expansion of their infrastructure “steadily through 2026,” which is good. But as you can see, the growth rate will be less intense going forward, and as often happens with “the spreadsheet effect” where forecasters draw straight lines a little up as time goes out, server revenue growth is expected to accelerate slightly between 2023 and 2026.
Interestingly, IDC provided revenue and forecasts for X86 servers and non-X86 servers, which we put into a table and looked at the annual change for both:
In 2020, when we had actual IDC server data, IBM accounted for 52.9 percent of non-X86 server sales from its Power Systems and System z lines, but going forward we think that Arm servers are going to account for just about all of the growth across the forecast period, on average. And that means Arm, and possibly RISC-V in the later years, will make up the rest. If you are optimistic about IBM server sales – meaning there is not much decline –then Arm servers should account for maybe 8 percent to 10 percent of total server revenues. If you are cynical, then IBM server sales could be cut in half but that will only add a few points to the Arm/RISC-V camp.
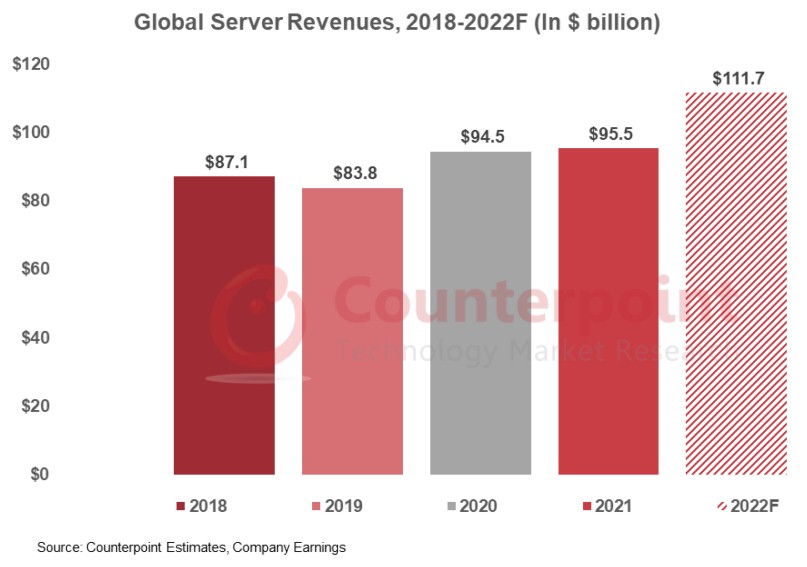
That brings us to the Counterpoint server forecast, which runs from 2018 through 2022 and which came out in June:
The Counterpoint numbers are a tad bit smaller than the IDC numbers, and it could be that Counterpoint is not counting the base operating system as part of its server sales. (We have reached out but have not heard anything as yet to clarify this.) Counterpoint is projecting for server revenues worldwide to rise by 17 percent to $111.7 billion.
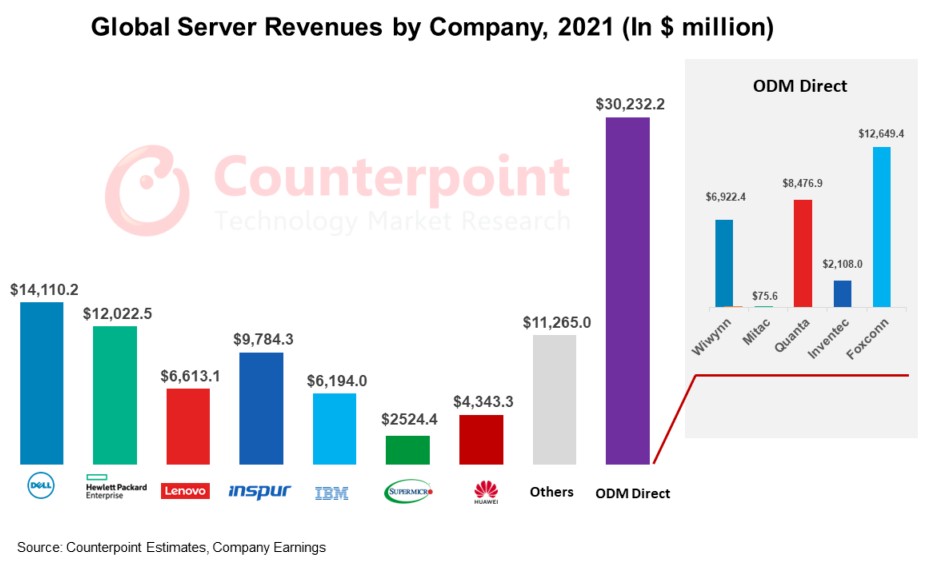
The interesting bit from what Counterpoint published is a full breakdown of servers by vendor, including the major OEMs and ODMs, not just the top five plus ODMs as a group like IDC does – or rather did – with its public data. Take a gander:
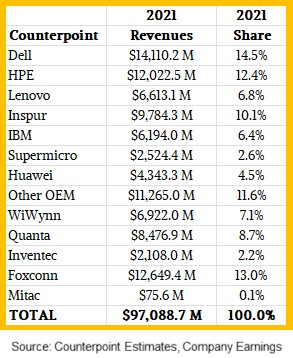
We plugged the numbers in this chart into a table and added them up, and they are larger than the 2021 numbers shown in the forecast above. (Our guess is Counterpoint has revised its server sales for 2021 but forgot to tweak its forecast chart.) This is a bit easier to read:
As far as Counterpoint knows, only four ODMs – Foxconn, Quanta, WiWynn, and Inventec – really generated big revenues from selling to the hyperscalers and the cloud builders. And Mitac is tiny by comparison and it is a wonder it was mentioned. There do not appear to be others as far as Counterpoint is concerned. Although we will point out that Dell, Lenovo, Inspur, Supermicro, Huawei, Sugon, and others who sell as OEMs also sometimes act line ODMs. The lines are blurry.
But the one thing that is clear is that everyone is still optimistic about server sales in 2023, and given the rollouts from Intel and AMD with their X86 server chips and AWS, Ampere Computing, Huawei/HiSilicon, and Alibaba for Arm server chips all ramping in 2023, this stands to reason.



Approximate installed base of v2/v3/v4/XSL/XCL components at 1,846,873,730 units. Breaking out by percent of core grades within each platform generation equals 184,698,104,484 cores and the average processor by core grade is 10 cores.
184,698,104,484 enterprise general compute installed base of cores / 32C processors = 587,966,135 units component replacement market. Except the installed base will never if or only slowly go away?
Reflect on how many commercial systems are tied to their applications, sought for their secondary market utility value on platform standardization, world market price performance, hidden from IT as lab tools, if its works don’t fix it? The massive multicore market is primarily additive [?] and miniscule in relation to the installed base. The question is, are current processor designs too complex to address installed base replacement.
and at / 64C = 293,483,067 components.
At 64 cores AMD and Intel could replace the entire installed base in less than three years. And at 32 cores within the four to six years Intel needs to recapture $234 billion in PC&E expansion effectively dodging suspect borrowing and Chapter 11 reorganization.
What AMD and Intel are not saying is that the business of compute is a consolidating phenomenon? Taking a diverse market of many and consolidating into a few player-controlled market. Enterprise will be reluctant? Open market will be resistant? A job is a job?
AMD and Intel and Nvidia also say only 1% of the market for accelerated compute is satisfied and are working on application demanders none of which is traditional science, on-line transaction processing, data base, enterprise systems, general business compute more or less. Vehicles as clients? Recommendation systems. Big brother and big sister. Virtual collaboration or virtual control?
Simple to complex. What’s the concern with massive multicores in their virtualized, partitioned, containerized feature set with the intelligence functions in relation to installed base = the cost of education, training and administration.
Power on electricity cost reduction sells but only if you can fully utilize cores and no one is talking about the cost of learning. Hyperscale requiring a computer science department to code hardware is the plug and play rack scale market?
Now let’s consider v2/v3/v4/XSL/XCL installed based replacement by Ice Lake split at 8C to 40C and I will round.
40C = 868 million completed component processors
38C = 502 M
36C = 1.5 billion
32C = 3 B
28C = 1.4 B
26C = 2.4 B market for 26C +
24 C = 269 M demarcation zone
20C = 2 B middle ground x2 the 10-core average
18 C = 45 M demarcation zone
16C = 1.7 B existing market for 16C and less
12C = 3 B
10C = 124 M
8C = 1.9 B
18,782,916,307 component processors that is 10x the v2/v3/v4/XSL/XCL installed base of processors. On the distribution of core counts and by removing greater than 40 cores three to six years of installed base replacement becomes 12.5 down to 9 years range 150 M to 200 M units per year supply on demanders.
Hyperscale / Cloud at 32C + = 5.9 B components
Enterprise at 20C to 28C = 6 B see the hybrid 50% split
General Business Compute at 18C and less = 6.8 B
Here’s Ice on a core basis supporting 18,782,916,307 component processors.
40C = 35 B cores
38C = 19 B
36C = 54 B
32C = 95 B
28C = 38 B
26C = 64 B market of 26C +
24C = 7 B demarcation zone
20 C = 41 B middle ground x2 the 10-core average
18C = 1 B demarcation zone
16C = 28 B existing market for 16C and less
12C = 36 B
10C = 1 B
8C = 16 B
Business of Compute = 202 B cores
Enterprise = 147 B cores
General Business Compute + 81 B cores
For Intel to recapture $234 billion in property, plant, construction and equipment expenditure, Intel has to sell 781,666,667 Xeon units at $1K $2444 for gross $1038 < $293 credit against R&D < $118 in MG&A < tax accrual and other minor costs = approximately $583 net per unit with some amount applied to PC&E. 781,666,667 component processor capacity expension cost offset is calculated on $300 net contribution per unit / $234 billion. So minimally Intel's net per unit of Xeon not taking CapEx from R&D falls to $283 per unit roughly equivalent CCG gross per unit.
Basically, Intel needs to get DCG production volume back up to 120 M units per year and charge full value for every unit of Xeon which means no more volume walking out the back door, and no more two for the price of one sale's close.
No more Intel social welfare. That means AMD too.
Mike Bruzzone, Camp Marketing