If the datacenter is the computer – and it certainly is for hundreds of companies comprising somewhere well north of half of server sales worldwide – then the Ethernet fabric, consisting of switches and routers, is the backplane of that computer.
And as a consequence of sales to the hyperscalers, cloud builders, and big service providers who are upgrading their networks to handle data intensive workloads, with a heavy emphasis on AI training and inference but also other kinds of distributed computing and distributed storage that requires fat Ethernet pipes, sales of Ethernet switching devices are booming as the cost per bit shifted is dropping across most of the bandwidth tiers.
There is always some wiggle, of course, and past datasets that were made public by the box counters at IDC used to make it fairly easy to figure that all out. But in recent reports, including the one that was just released that covers the Ethernet market for the first quarter of 2023, IDC has stopped giving out the rate of growth for port counts each quarter even as it is still talking about revenue growth by Ethernet device type (switch or router), by bandwidth segment, and by vendor. So we have had to do our best to estimate port shipment growth to figure out average port price and vice versa.
We do what we can in an effort to try to understand what is going on out there in the datacenters of the world.
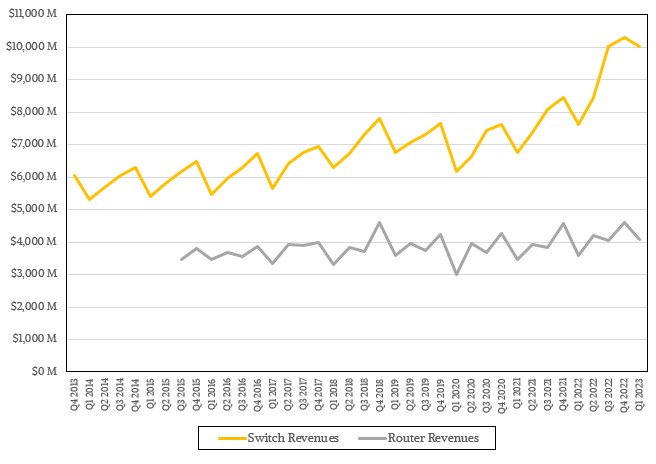
As best as we can figure, worldwide switch sales climbed by 31.5 percent to just a hair over $10 billion, marking the third quarter in a row that it broke through the $10 billion level and representing what is perhaps a new floor in switch sales or a local maxima that might collapse after one, two, or three more quarters until the next upgrade cycle begins in earnest. Router sales rose by 14.1 percent to $4.09 billion.
We don’t know for sure, and as supply chain issues get resolved and switch makers are more able to meet demand, we can expect that the switch ASIC makers and switch device makers, where they are distinct, will lose some of the much-welcomed and much-needed visibility into the infrastructure plans of the world’s largest IT buyers. The hyperscalers and cloud builders only tell their suppliers the bare minimum and they always expect to go to the front of the line given the volumes they buy, and with parts shortages running at anywhere from 12 months to 18 months during the coronavirus pandemic, these companies had to fess up if they had any hope of scheduling upgrades to their existing datacenters or rollouts of new ones with shiny iron.
With vendors still burning down order backlogs for networking gear, we think there are probably one or two more quarters of very good sales and that there is a non-zero chance that revenue levels return to a new, higher normal level after that. This market likes to sawtooth, as you can see in the chart above.
The market for routers, which has been under siege in recent years by hybrid ASICs that can do switching and routing, is trending ever so slightly up as it moves to the right each quarter. Sales of switches in the datacenter, on the campus, and on the edge collectively are trending up at a slightly exponential rate, and have recovered from a flattening in sales that happened in 2019 – well ahead of the pandemic – and that continued as more than a few companies skipped the 200 Gb/sec Ethernet upgrade cycle. Now, with AI driving a lot of networking decisions and datasets just getting bigger and bigger for all kinds of workloads in the datacenter, companies are starting to install 200 Gb/sec and 400 Gb/sec devices and some are even rolling out 800 Gb/sec devices for interconnects linking together distinct datacenters within regions.
And so, the revenues are on the rise faster than the port counts are rising, we think.
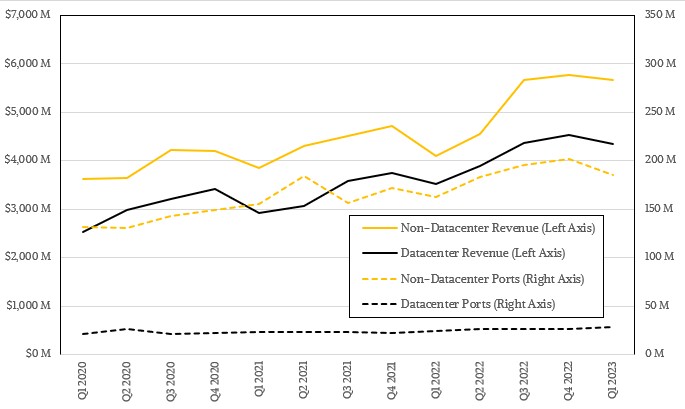
In the past two years, IDC has been giving us some insight into what is going on with datacenter switching as distinct from edge and campus switching, which is helpful as we try to maintain the model we have been building since 2013 based on the IDC data.
In the first quarter, datacenter switch sales rose by 23.2 percent to $4.35 billion, representing 43.3 percent of total worldwide Ethernet switching revenues. The cumulative number of Ethernet switch ports shipped into the datacenters of the world rose by 19.7 percent to 28.9 million, and only represented 13.4 percent of the total 214.7 million ports shipped. There were 185.9 million ports shipped in the campus and at the edge, an increase of 14.1 percent year on year, and these drove $5.67 billion in sales, up 38.7 percent.
This gives us a sense, in the aggregate, what the port growth rates are within the various subsegments of the datacenter market, which is mostly devices with 100 Gb/sec and higher bandwidth these days, but in the enterprise still includes a fair amount of devices with 10 Gb/sec ports.
When we take everything IDC said in its report and do our guesstimating, and then sum it all up, here is what we think happened with Ethernet switching in the aggregate in Q1 2023:
As usual, everything in bold red italics is an estimate by The Next Platform. Remember this is not the installed base, but new switch sales for the quarter. With switches sitting in the field for five, six, or seven years in the big datacenter operators and even longer in enterprises, governments, and academia, there is probably a mountain of some truly crufty stuff out there. But, in time, it will all be replaced, especially as the cost per bit comes down at an exponential rate for ever-more-capacious Ethernet switches.
All told, by our math, there was 2,652.3 exabits per second of aggregate switching capacity sold in the first quarter of 2023, an increase of 29.7 percent in aggregate bandwidth.
Those 200 Gb/sec and 400 Gb/sec devices represent only about 1.35 percent of ports shipped but account for 6.3 percent of revenues and 33 percent of exabytes shipped. Which means these faster devices are providing a hell of a deal after being in the market for two years now and costing a lot more back then than they do now. Sales of 100 Gb/sec devices accounted for 23.5 percent of Ethernet switch revenues and 36 percent of Ethernet switch aggregate bandwidth across all use cases, but only 4.4 percent of ports shipped in Q1.
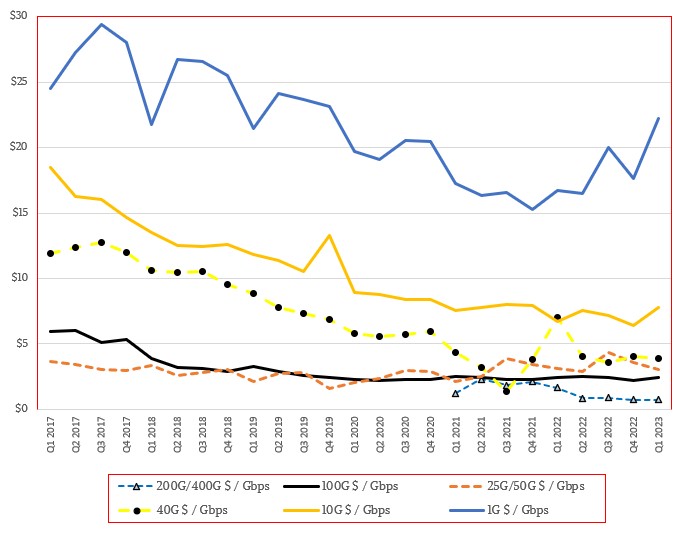
Here is what the trend of costs by port speed looks like over time, according to our calculations:
That upturn in pricing for the 1 Gb/sec switches seems peculiar and we are not sure that we believe it; such spikes were not uncommon when we had port count data, and it may be that the market is preferentially liking 2.5 Gb/sec and 5 Gb/sec devices at the low end and 1 Gb/sec devices are in shorter supply and therefore prices have upticked.
What is more important is that as you move up in bandwidth, the cost per bit comes way down. If the average cost per bit of the midpoint between 200 Gb/sec and 400 Gb/sec devices is 90 cents, then let’s say for argument’s sake that it is 60 cents for 400 Gb/sec devices and 120 cents for 200 Gb/sec devices. On a 1 Gb/sec device, the cost per bit shifted is around $20. So that is a 400X increase in bandwidth for a 33.4X decrease in the cost per bit shifted.
Talk about having to make it up in volume.
Think of it this way. If you had to make a 400 Gb/sec switch using 1 Gb/sec technologies, it would be outrageously expensive. Like over $1 million, and that is assuming you had some kind of perfect backplane or could make a chip the size of the dining room table. But the average 400 Gb/sec switch looks like it costs somewhere around $32,000 using 51.2 Gb/sec ASICs and around $16,000 using 25.6 Gb/sec ASICs that only deliver half as many 400 Gb/sec ports.
Conversely, if you only needed 1 Gb/sec ports and, provided you could make a 3D array of ports all link to a single high-end switch 51.2 Tb/sec ASIC, you could in theory wire up 51,200 endpoints to each other in a single switch for the same money, or for a factor of 33.4X lower cost per 1 Gb/sec port than the real devices cost. All those physical ports and wires would probably cost a lot more than the ASIC, of course. (We’re just having fun here with Moore’s Law.)
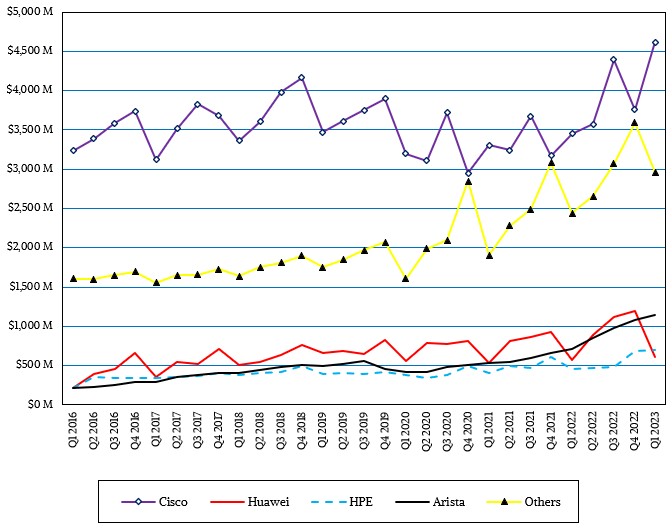
Now, let’s talk about vendors for a minute. It looks like Cisco Systems is gaining back some market share, and we think it is due to a certain extent to the advent of the Silicon One merchant silicon effort, which has made it safe to invest in Cisco ASICs either directly or indirectly. (It will be a frigid day in Hades when Arista Networks adopts the Silicon One devices in its switches, but stranger things have happened in the world.)
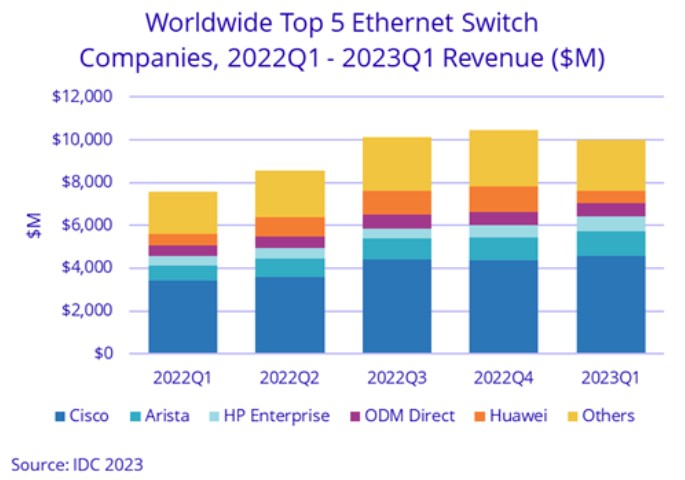
Here is the official IDC chart showing vendors over time:
And here is ours, which has a longer time horizon and which is much easier to read:
In Q1 2023, Cisco had 46 percent of sales, at $4.61 billion, up 33.7 percent, which is a little bit faster than the market at large. Arista Networks is the fastest grower, up 61.6 percent year on year with $1.15 billion in sales. Hewlett Packard Enterprise rose by 54.9 percent to $701 million in the period, and we think all three companies rose so much because they were able to take big bites out of their backlogs.




“Box counter” [?] isn’t there a more eloquent way of saying microeconomics or production economist I prefer data scientist, industrial science for industrial management it’s not all component counting but if you don’t count components, you don’t have that data base for assessment. Besides counting boxes sells computers because data bases rarely get smaller. Mike Bruzzone, Camp Marketing
Hey folks.
What is this unit called port? How do i calculate the number of ports in a 400G or 100G switch?
Thanks.
Not sure why it is called a port. Maybe because it is where data is loaded and unloaded?
The number of ports varies by ASIC bandwidth and port speed. At 51.2 Tb/sec, if you want 800 Gb/sec ports you can have 64, for instance, or 128 at 400 Gb/sec or with cable splitters you can do 256 at 200 Gb/sec.