If the bi-annual list of the world’s fastest, most powerful supercomputers was used as indicator of key technological, government investment, and scientific progress, one could make some striking predictions about where the next centers of worldwide innovation are likely to rest.
With China clinging to its dramatic top placement on the list for the fifth consecutive iteration of the list, which was just announced at the International Supercomputing Conference in Frankfurt, Germany, the U.S. position only just holding steady, and Japan’s new wave of systems taking hold, the global playing field at the highest end of computing is set for some interesting times.
Interestingly, despite its far-and-away win with the Tianhe-2 supercomputer, the number of systems in China has dropped significantly over the last year. In November of 2014, the country claimed 61 systems on the Top 500—a number that has plummeted to 37 with the retirement of several systems that were toward the bottom. The United States is holding steady with 230 machines on the Top 500—an impressive number, but this is the fewest supercomputers on U.S. soil outside of one other drop (down to 226) in the early 2000s.
The stunning supercomputing story of late has been in Japan (and as an up-and-comer, South Korea), which is the #2-ranked user of HPC on the planet. In June 2010, Japan had 18 systems on the list. By 2012, there were 35 (including the K Computer, which is still top-ranked), in 2013 there were 30. And in the list for this summer there were a total of 39. In addition to the successful Fujitsu-built K Computer, the TSUBAME 2.5 machine and the upcoming (2016) TSUBAME 3.0 system will take top spots on the list, rounding out the hardware and software investments of Japan’s HPCI program, which is the nation’s umbrella for reaching eventual exascale targets in the post-2020 timeframe.
The share of European systems is quite large as well—and growing slightly. On the November list there were 130 systems, which has jumped to 141. And while Asian machines are the topic of a great deal of conversation (and an upcoming panel that we will be covering this week) there are 107 systems from Asia now, down from 120 in November.
While developments in Japan, South Korea, Russia are noteworthy, to be fair, only a relatively small fraction of high performance computing sites run the LINPACK benchmark (estimates are between 15-20%), which is the metric by which Top 500 placement is determined. To make economic and competitiveness predictions on this alone would be laden with caveats. However, one of the biggest trends of note is that the list overall, across countries and systems types, is in a rut with unprecedented low replacement rates and old systems that are still running the benchmark and keeping the list essentially where it was in late 2013-early 2014.
While there might not be any earth-shattering new supercomputers to surprise and awe us on the latest round of the Top 500 fastest systems announcement today, the relative calm of the list speaks a great deal, even for those who do not regularly follow advances in supercomputer performance. Investments and progress toward ever-faster Top 500 machines is an indicator (and outcome) of economic, scientific, and industrial growth, so for this June’s list, it is useful focus a bit less than usual on the systems themselves and more on some of the key movements that define supercomputing in 2015.
Inside the July 2015 Top 500 List
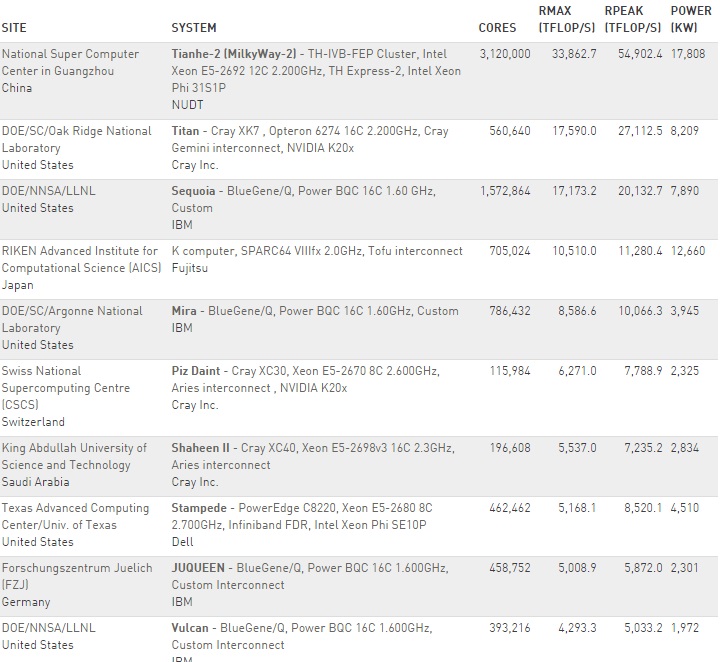
For those who follow the bi-annual rankings of the world’s fastest supercomputers, the top of the list will look quite familiar, with the Tianhe-2 machine in China far outpacing its closest competitor, the Titan system at Oak Ridge National Laboratory. This is the fifth consecutive time the Chinese supercomputer has run away with the top spot—a trend is unlikely to change for November’s new benchmark results, especially since some of the largest upcoming new systems (Summit, Aurora, and others) are not due to be installed until the late 2016 to 2018 timeframe. In fact, within that top ten, the only change is the addition of a new entry—the #7 ranked Cray XC40 “Shaheen II” supercomputer at King Abdullah University of Science and Technology (KAUST) in Saudi Arabia. The top ten, in order, is below.
There are new machines coming to national labs in the U.S. and elsewhere around the world in the coming two to three years that will alter the curve significantly once again at the top, but for now, total list-by-list growth rates tracking performance are at an all-time low over the last two years. There has been little turnover at the top of the list and the replacement rate throughout the Top 500 is far lower than usual. The only new machine in the top ten was installed this year and the top supercomputer in the world in China was installed in 2013. As the Top 500 founders noted today at ISC ’15, “the age of the population in the top 10 is unprecedented” and the replacement rate for machines at both the top and bottom of the list is also slower than any point since the list was introduced in 1993.
“The list is depressed, it’s definitely down from traditional rates we’ve seen in the past,” Jack Dongarra, one of the original creators of the LINPACK benchmark and the companion Top 500 list, tells The Next Platform. This is supported by the fact that the performance of the last system on the list (number 500) has consistently lagged behind historical growth trends for the past five years, a trajectory that now increases by 55 percent each year. Between 1994 and 2008, however, the annual growth rate for the number 500 systems’ performance was 90 percent.”
As for the slowdown, Dongarra says he does not think it is a matter of more centers waiting for new architectures, rather it is a signal of the economic impacts of cutbacks and austerity measures in Europe and the U.S. in particular.
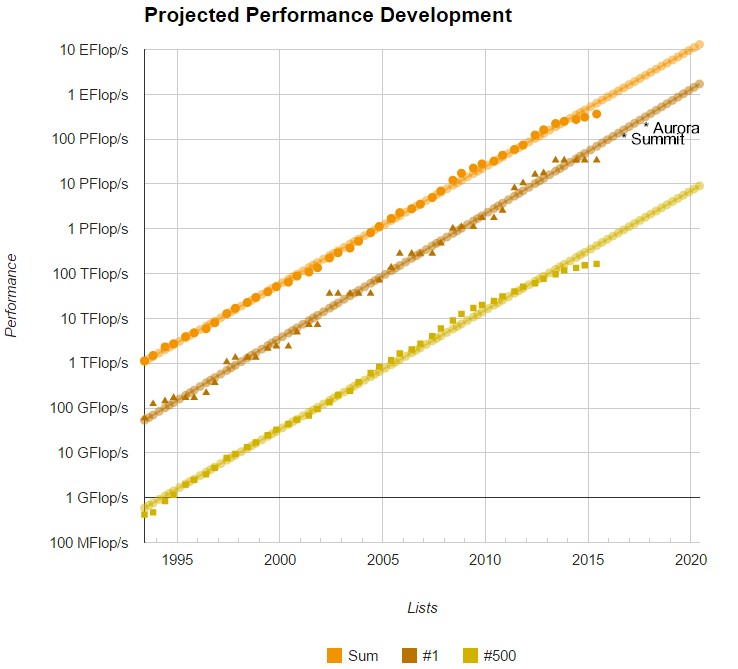
Six months ago, there were 50 systems on the Top 500 that achieved a petaflop or better sustained performance and while that number has jumped for this incarnation of the list to 68, the growth in performance capability of big machines is not as rapid as we have seen in previous years. Remember too that the next grand challenge for large-scale supercomputers is to reach exascale-level performance sometime (depending on who you ask) in the 2019-2022 timeframe. As seen in the chart below that tracks the progression of performance, the current systems are not on the trend line toward exascale. Notice too that there are some upcoming machines added to the list to highlight how they might change the curve when they come online in the next few years.
To be fair, we are using the specs for systems that have not been built yet (Aurora and Summit have been added). These are also the minimum starting numbers for the machines, which will receive upgrades over successive years to become far more high capability than seen here. The point is, it provides enough perspective to see that exascale road will not be an easy one for the hardware alone—to say nothing of all the in-depth code work that will be required to run real applications.
 In addition to the new systems that are set to come online in the coming years, there will have to be a shake-up in the top ten since the now discontinued IBM BlueGene architecture still captures 40% of the top ten with the third, fifth, ninth, and tenth place systems.
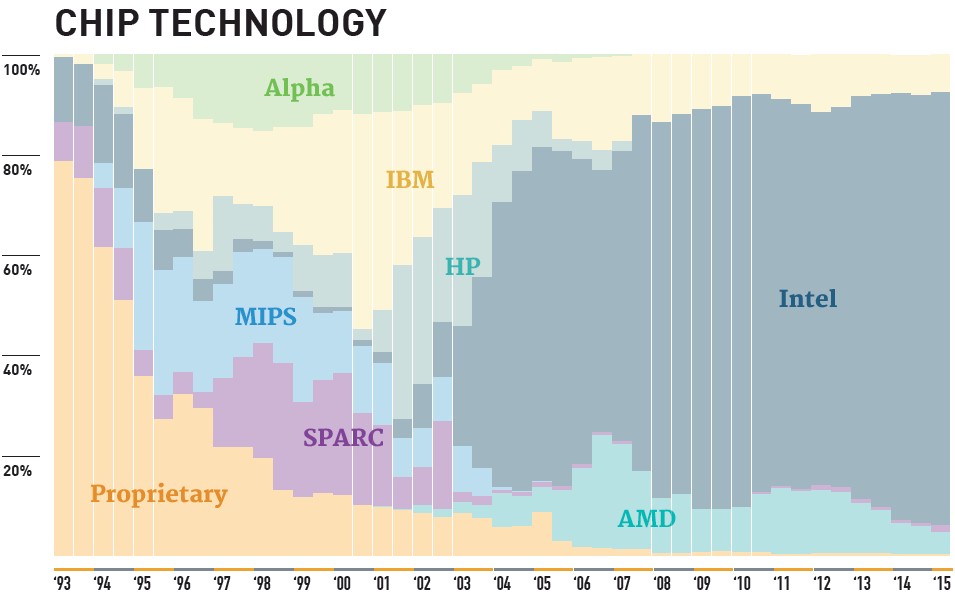
But even with those numbers at the top tier, Intel is still far and away the dominant processor vendor in the Top 500 with just over 86% of the share. For perspective, AMD Opterons are installed in 22 of the top 500 systems (4.4%, down from 5.2% on the November 2014 list) and IBM has held steady with 8% of the processor share.
To say Intel dominates the list would be an understatement, but they are also doing well outside of sheer host processor territory with a slight uptick in the use of their Xeon Phi coprocessor. A total of 33 systems now use the Xeon Phi and four systems are using a combination of both Xeon Phi and NVIDIA GPUs for acceleration.
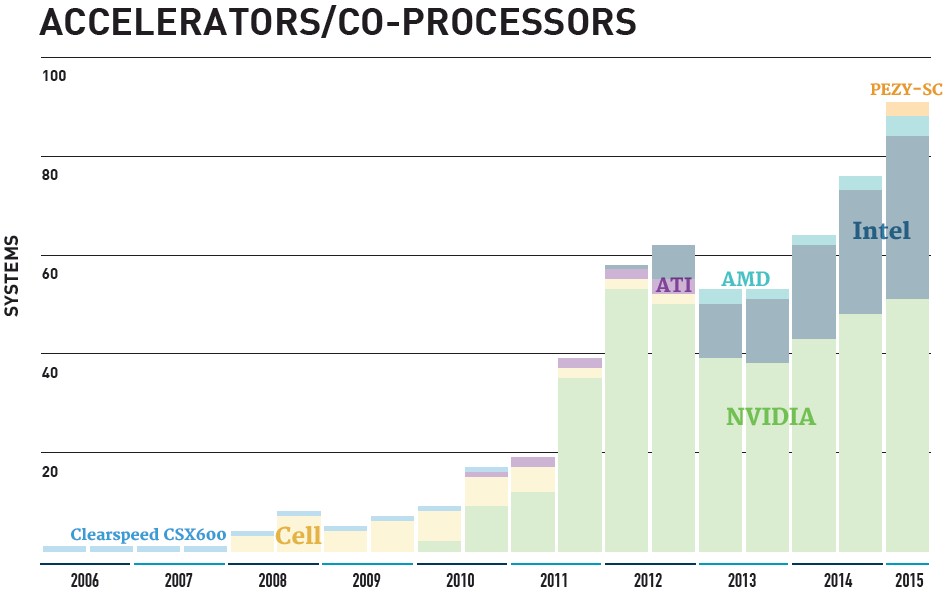 The accelerator use curve hit a growth spurt in the 2010-2013 timeframe but the slope has leveled off somewhat in the recent few lists. As of now 88 of the top 500 systems are using accelerators, 52 of which are leveraging NVIDIA GPUs, and the rest with Xeon Phi, although there are also four machines using ATI Radeon cores. Of note is the addition of a new accelerator from Japanese chipmaker, PEZY Computing. Two machines, both in Japan #162 and #366 are using the PEZY-SC accelerator on an Infiniband-connected Exascaler Inc. liquid cooled cluster with 8-core Xeon E5 v3 host processors. We will be attempting to talk to PEZY this week to see how the ARM-based accelerators are used in concert with the Xeons. Another growth curve to watch is around InfiniBand technology, which is now found on 227 systems, up from 225 on the last list in November. On the flip side, gigabit Ethernet has dropped from 187 to 147 systems due to 84 new systems that are using 10GbE interfaces.
When it comes to packaging all these technologies for the Top 500 and equivalent HPC systems worldwide, IBM and HP are at the top of the list across the performance share for all of the list. The developing story, Lenovo, will be interesting to see play out over the next few lists, but for now they have only three systems where they are listed as the sole vendor and are coupled as both IBM/Lenovo for an additional 17 machines. When it comes to raw system sales, HP has the top spot with 178 machine compared to 111 from IBM. To put the IBM/Lenovo acquisition into context, consider that in November 2014, IBM had 153. Cray continues to have a strong story in its third place position with 71 machines but they have the Top 500 performance share in the bag with 24% share of installed total performance—a number that has jumped 18.2% since November.
For more about this summer’s list and the top supercomputers that made the cut, take a look here.
Comments are closed.



Hi, thank you for your mentioning us, PEZY Computing K.K. and ExaScaler Inc. in your latest article.
It is a common misunderstanding, but “PEZY-SC” is not using ARM cores for HPL processing at all. We have 2 small ARM 926 cores mainly for debbugging and maintenance purpose. Our MIMD core is proprietary one we have developed in-house.
Your are welcome to our ExaScaler/PEZY Computing Booth at #452.
Best Regards,
Motoaki Saito, M.D., Ph.D.
Founder/President/CEO of PEZY Computing K.K.
Founder/Chairman/CEO of ExaScaler Inc.
I think it’s more than just economics and centers waiting for new architectures. Although, considering that everyone’s been awaiting Knights Landing and Nvidia GP100, why buy an already obsolete architecture GPU from 2012 or a current Xeon Phi when we know what’s about to be released?
Wait time calculations are necessary, and a very good idea, when picking architectures for systems costing hundreds of millions to over a billion(like K).
I suspect it might also have something to do with lessons learned from accelerator and CPU systems only being about 65% computationally efficient and not terribly competetive on the Graph500(at least based on their Top500 rank and size).
The relatively unsophisticated and inefficient architectures that can place high in HPL arent necessarily very useful toward exascale either. I expect to see what happened with Earth Simulator and K happen again. Proprietary vector and SPARC systems may not be popular but they can end up being the best.